 Google
 Microsoft
 Adobe
Adobe Canva
Canva Kaspersky
Pingroupie
$43.00

$43.00
Sent via customer’s email
12-24hrs
All-in-one Subscription
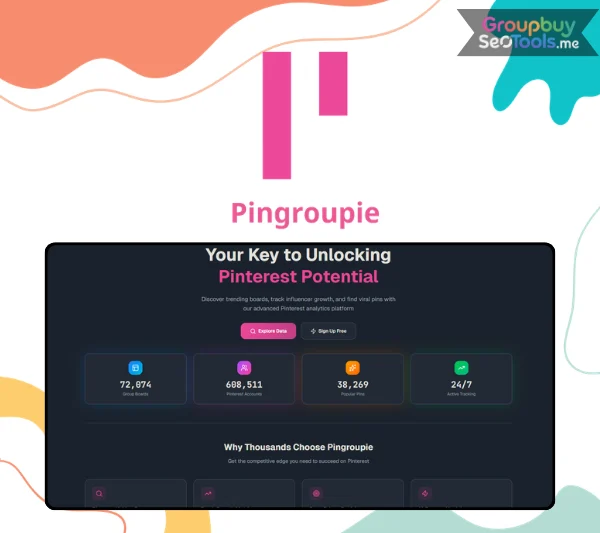
Pingroupie: Automate SEO titles and keywords, design graphics instantly, and streamline multi-account scheduling.
Two Pinterest accounts. Same niche. Same content quality. One grows steadily — cracking new audiences, generating consistent traffic, climbing the algorithm’s favor month over month. The other publishes just as consistently and wonders, month after month, why the results never arrive.
The gap between them is almost never what it appears to be.
It is not posting frequency. It is not image quality. It is not even keywords. The gap is almost always intelligence — specifically, the kind of competitive intelligence that the winning account has and the stalling account does not: which boards in the niche are actively trending and worth contributing to, which pin formats are generating the most saves and clicks right now, which influencers are on growth trajectories worth understanding, and where each account actually stands relative to the competitive field it is competing in.
Pinterest’s native analytics tool will not give you any of that. It gives you your own data — comprehensively, accurately, and in a dashboard that tells you everything about what you have already done and nothing about what the rest of your niche is doing.
Pingroupie (pingroupie.com) was built to fill exactly that blind spot. Its suite of spy tools — board analytics, viral pin tracking, influencer discovery, competitor benchmarking, and growth metrics monitoring — delivers the competitive intelligence layer that turns Pinterest from a platform you post on and hope for the best into one you navigate with full market visibility.
Here is the complete picture.
Great for technical markers who prioritize metric tracking, audience engagement data, and algorithmic discovery.
Pingroupie is a dedicated Pinterest analytics and competitive intelligence platform organized around four modules: Boards, Pins, Pinners, and Analytics. The platform does one thing — Pinterest competitive intelligence — and does it with a depth that generalist social media tools managing six platforms simultaneously simply cannot replicate.
The clearest frame for understanding Pingroupie is to start with what Pinterest Analytics is, and is not. Native Pinterest Analytics is exceptional for measuring your own account’s performance. Impressions, saves, clicks, engagement rate, audience demographics — the native dashboard covers all of it, for your account, with genuine detail.
What it does not cover is the competitive landscape your account exists inside. It will not tell you which boards in your niche are currently gaining followers fastest. It will not identify which pins are going viral in your product category this week. It will not surface which influencer accounts are growing most rapidly or reveal what the top performers in your niche are doing differently than you are. Every question that starts with “how does my niche…” or “what are my competitors…” hits a wall with native analytics.
Pingroupie was purpose-built to answer those questions.
Its roots are in what remains its most distinctive feature: the most comprehensive searchable database of Pinterest group boards ever assembled. Marketers have used it since its early days to find and vet collaborative boards across any niche — and that database remains unmatched in its depth. The full spy tools suite built around it transforms Pingroupie from a board directory into a complete competitive intelligence environment.
Free tier: top-10 boards and influencers in key categories, basic group board search, three months of influencer growth data. Premium at $9.99/month: full database, complete analytics, extended history, all filters and sorting unlocked.
Pingroupie’s spy tools form an interconnected system rather than a collection of independent features. Each module builds on the others, and the intelligence they produce together is more strategically complete than any single capability alone.
The Board Analytics module is simultaneously Pingroupie’s most practical and most strategically powerful feature. It makes the group board ecosystem of any Pinterest niche fully observable — sortable by follower count, collaborator count, pin activity, and engagement signals — and adds the trending layer that separates reactive research from proactive strategy.
Most Pinterest marketers pick boards by searching keywords and selecting the results that look largest. Board Analytics reveals why this approach consistently underperforms: the boards that generate the most distribution value are not always the ones with the most followers. They are the boards with the best audience-to-engagement ratios, the healthiest contributor activity, and — critically — the ones that are currently gaining momentum rather than sitting on a static audience built years ago.
The trending board capability identifies boards gaining followers at an accelerating rate right now. The strategic implication is direct: getting content onto a board during its growth surge, before it saturates with contributors, is worth significantly more than arriving after it has plateaued. Pingroupie makes this timing advantage actionable rather than accidental.
The competitive application adds another layer of intelligence. Analyze any competitor’s board portfolio through Pingroupie and you extract their entire distribution strategy — every group board they have identified as valuable, already vetted by the results they are generating from it. That intelligence turns board selection from a keyword search exercise into a data-backed replication of what is already working in your niche.
Before Pingroupie, understanding what was performing on Pinterest in your niche required manual observation — browsing search results, noting which pins appeared to be popular, and forming a creative impression of what was working based on surface signals like high repin counts.
The Pin Performance Tracking module replaces that observation-based approach with measurement. It identifies the top-performing pins in any niche and ranks them by the metrics that explain why they are performing: save rate (engagement intensity per impression), repin velocity (how rapidly saves are accumulating over time), and click-through rate (how effectively a pin converts engagement into intent-driven action).
Each metric tells a different strategic story. A pin generating a high save rate but low click-through is winning the discovery game — audiences find it visually compelling and worth keeping — but not converting that appeal into traffic or purchases. A pin with a lower save rate but high click-through is efficiently converting the smaller audience it reaches into meaningful action. Understanding which type of performance your niche’s best content produces shapes creative decisions in ways that generalized advice about “great Pinterest content” never can.
For content creators, this module closes the gap between content intuition and market reality. The creative styles that feel current and effective are often running six to twelve months behind what the platform’s algorithm and audiences are actually rewarding. Quarterly pin performance analysis in Pingroupie replaces outdated intuition with current evidence — and the difference between content strategy built on dated assumptions and strategy built on live data is measurable in traffic numbers.
Pinterest influence operates differently than it does on most other platforms. The relationship between follower count and actual content reach on Pinterest is looser than elsewhere — the algorithm’s amplification mechanism rewards engagement quality and save velocity in ways that can make a smaller account’s content circulate far more widely than a larger account posting less engaging material.
The Pinners module makes this influence landscape navigable. Search any Pinterest category and it surfaces the accounts that are actually driving impact: ranked by engagement rate relative to follower count, sorted by growth trajectory, and filterable by content type and posting frequency. The distinction between large accounts and influential accounts is often significant — and Pingroupie’s metrics make it visible.
The free tier reveals the top 10 accounts in select categories with three months of follower growth and total audience data. Premium unlocks the full database with detailed engagement breakdowns, content portfolio analysis, posting frequency history, and the specific topic and format combinations generating the highest engagement per account.
For brands and agencies, this transforms prospecting from a volume exercise into a precision one. Filtering by niche, validating engagement authenticity through rate-relative-to-size metrics, reviewing content alignment, and confirming growth trajectory before any outreach investment is a professional workflow that $9.99/month now makes accessible to independent creators and small brands — not just enterprise marketing teams.
The growth trajectory dimension deserves particular emphasis. Accounts growing at above-niche-average rates today are the category’s major voices in six to twelve months. The window for building authentic relationships — before high follower counts make access expensive and full inboxes make responsiveness unlikely — is the growth phase. Pingroupie’s trajectory data identifies that window precisely.
There is a version of Pinterest analytics that most marketers experience: reviewing your own metrics, noting that engagement rate was up 8% last month, and having no reliable way to determine whether that improvement represents strong competitive performance or simply recovery from an earlier dip.
Competitor benchmarking replaces that ambiguity with a defined competitive reference frame. Compare your account’s follower growth velocity, average engagement per pin, save rates, and board activity against a specific set of niche competitors. Understand where you sit in the distribution of niche performance — not relative to your own history, but relative to the accounts competing for the same audience attention.
The value of this reframing is consistently underappreciated until marketers experience it directly. When benchmarking reveals that your save rate tracks 30% below the niche average, that single finding is more actionable than six months of improvement-from-baseline data. It identifies the specific gap and provides a clear optimization target. When it reveals that your follower growth rate is above the niche average, it confirms that what you are doing in that dimension is working — and you should not change it in pursuit of perceived improvement.
The longitudinal tracking dimension adds strategic depth that snapshots cannot provide. Watching a competitor’s engagement rate accelerate across consecutive measurement periods is a market signal. Something in their approach has changed, and it is working. Identifying that shift early — while you still have time to learn from it rather than respond to it after the competitive damage is done — is exactly the kind of advantage that regular benchmarking creates.
Pinterest native analytics measures the performance of your account in isolation. Every metric it shows you is contextually unanchored — you know your engagement rate went up, but you do not know if that improvement outpaced, matched, or lagged the category’s average movement over the same period.
Growth Metrics Monitoring adds the context that makes performance data strategically interpretable. Follower growth velocity tracked against a competitive set reveals whether your account’s growth is genuinely outperforming the niche or simply tracking with a rising category tide. Engagement trend analysis across multiple accounts separates performance shifts attributable to your own content quality changes from shifts caused by algorithm updates that affect everyone in your category simultaneously.
Pin frequency benchmarking adds a publication strategy dimension: whether your posting cadence is significantly different from the top performers in your niche, and in which direction, is information that changes how you should think about your content calendar — evidence-based rather than based on general Pinterest advice.
The seasonal intelligence is the module’s most practically underused capability. Category-level engagement on Pinterest has seasonal patterns that individual account data is too variable to reliably extract. Pingroupie’s aggregated niche data surfaces these patterns — identifying historically high-engagement periods in specific categories — so content calendars can be built around validated seasonal windows rather than generic seasonal assumptions.
Pingroupie began as a group board database before it was anything else, and that foundation remains its most distinctive standalone capability. Group boards — collaborative Pinterest spaces where multiple accounts contribute content and every contributor’s pins reach the board’s full audience — are one of Pinterest’s most powerful organic distribution mechanisms. A pin published to a quality group board with 60,000 followers reaches that audience regardless of whether the contributing account has 400 followers or 400,000.
Pingroupie’s searchable database makes these boards findable by keyword, category, and title, with sorting and filtering options that separate boards with genuine distribution value from ones that only appear promising. Follower count filtered against recent contributor activity and engagement signals identifies the boards where your content will actually circulate — as opposed to boards with large historical follower counts that have been algorithmically deprioritized by low-quality content accumulation.
The spy tool application extends beyond your own board research. Mapping any competitor’s group board contribution history through Pingroupie extracts their distribution strategy — the specific boards they have identified and validated as worth their time. Replicating that portfolio, supplemented with high-quality boards they have missed, gives you a distribution foundation built on competitive evidence.
Perfect for shifting the user’s mindset toward profit margins by showing how much overhead they slash when eliminating repetitive subscriptions.
| Feature | Free | Premium $9.99/mo |
| Group Board Discovery | Top 10 categories | Full database |
| Board Analytics | Basic | Complete analytics |
| Pin Performance Tracking | Limited | Full niche coverage |
| Influencer Discovery | Top 10 + 3-month growth | Full database + all metrics |
| Competitive Benchmarking | Limited | Full suite |
| Growth Metrics Monitoring | Limited | Comprehensive |
| Historical Data | 3 months | Extended |
| Advanced Filters & Sorting | Basic | Full |
| Data Export | ❌ | ✅ |
The free tier provides enough genuine intelligence — top boards and influencers in key categories, three months of growth data, basic board search — to evaluate whether the competitive intelligence quality justifies the Premium upgrade. It is not a marketing-premise free plan that immediately frustrates access; it is a functional entry point.
Premium at $9.99/month is the most affordable dedicated Pinterest competitive intelligence offering in the market. The intelligence depth it unlocks — full board database, complete influencer analytics, comprehensive competitive benchmarking — would represent a significant subscription cost in any broader social media monitoring platform. As a Pinterest-specific tool, the pricing reflects the platform’s focused scope.
| Capability | Pingroupie | Tailwind | Pinterest Native | Later |
| Competitor board analytics | ✅ Purpose-built | Limited | ❌ | ❌ |
| Niche-wide viral pin tracking | ✅ | Limited | ❌ | ❌ |
| Pinterest influencer database | ✅ | ❌ | ❌ | ❌ |
| Group board discovery | ✅ Best-in-class | ❌ | ❌ | ❌ |
| Competitive benchmarking | ✅ | Limited | ❌ | ❌ |
| Growth trajectory tracking | ✅ Multi-account | Own account only | Own account only | Own account only |
| Pin scheduling and publishing | ❌ | ✅ | ✅ Limited | ✅ |
| Visual content calendar | ❌ | ✅ | ❌ | ✅ |
| Free plan usefulness | ✅ Genuinely functional | ✅ Trial | ✅ Always free | ✅ |
| Paid plan entry price | $9.99/mo | $14.99/mo | Free | $25/mo |
The most useful frame for this comparison: Pingroupie and Tailwind (or Later) are complementary tools, not competing ones. Pingroupie generates the intelligence that informs what to create and where to distribute it. Tailwind or Later execute the distribution. Together they form a complete Pinterest marketing stack for $25–35/month that is more capable than any single platform covers independently.
Pinterest native analytics remains the foundation for own-account performance monitoring — free, accurate, and comprehensive for its scope — and pairs naturally with Pingroupie’s competitive intelligence without any redundancy.
Pinterest’s evergreen content algorithm means that well-structured pins can generate traffic for a year or more after publication. For creators treating Pinterest as a primary traffic channel, the intelligence that Pingroupie provides — which content formats are performing, which boards are amplifying results, which influencers are setting audience expectations — is the research layer that separates a strategy from a hope.
Pinterest users skew toward purchase-intent discovery. For product-based businesses, the pin performance module’s click-through rate data identifies which product presentation styles are generating intent-driven traffic rather than passive engagement — the distinction that connects Pinterest strategy to revenue rather than just reach.
Multi-client Pinterest management requires competitive context that native analytics does not provide. Pingroupie enables niche-specific research for each client account simultaneously and makes monthly performance reporting substantively better — contextualizing metrics against the competitive field rather than presenting isolated own-account trends.
The most expensive way to learn what works on Pinterest is through trial and error in your own account across many months. Pingroupie makes the competitive landscape observable from day one — identifying the boards worth targeting, the content formats currently performing, the influencers defining niche standards — and compresses the learning curve that native analytics alone would extend over a year of observation.
1. Start every strategy session with a competitor board portfolio audit. Before choosing which boards to contribute to, map the board portfolios of your top three competitors through Pingroupie. Their boards are already validated as distribution-worthy by the results they are generating. Use that portfolio as your outreach starting point rather than keyword searches.
2. Update your creative brief quarterly, not annually. Pinterest creative trends evolve faster than annual reviews capture. Use the Pin Performance Tracking module every quarter to refresh your documented patterns — headline structures, aspect ratios, visual styles, topic angles — from the niche’s currently viral content.
3. Track influencer growth trajectories monthly. Spend 15 minutes per month reviewing which accounts in your niche are showing the strongest follower growth over the previous 30 days. Growth-phase accounts are your best relationship-building targets before audience scale makes them expensive to approach.
4. Cross-reference viral pins with board distribution. When you identify a top-performing pin in your niche, identify which boards it is appearing on. Those boards are demonstrating active amplification right now — prioritize them in your outreach list ahead of boards with larger audiences but lower recent engagement signals.
5. Time your highest-effort content to seasonal engagement windows. Use Pingroupie’s category-level growth data to identify the months in your niche when engagement historically peaks. Plan your strongest content releases to coincide with these windows rather than distributing them during characteristically quiet periods.
6. Build a “gap board” list alongside your competitor list. Alongside the boards your competitors are using, identify high-quality boards where none of your primary competitors are present. These are distribution channels with relevant audiences and no competitive noise from the accounts you are trying to outperform.
7. Let benchmarking set your optimization priority order. Before deciding what to improve in your Pinterest strategy, run competitive benchmarking to identify which metrics show the largest gap between your performance and the niche average. Closing the largest verified gap is always more efficient than generalized improvement attempts.
| Time | 1 Year |
|---|
There are no reviews yet.